What the business earns in a normal year.
Seven years verified, one-offs removed, margins taken across the cycle. Owner earnings, not reported EPS.
Stages 2–5The research system we build for each firm, around its own rubric. It verifies seven years of numbers, values the business conservatively and argues the thesis against itself.
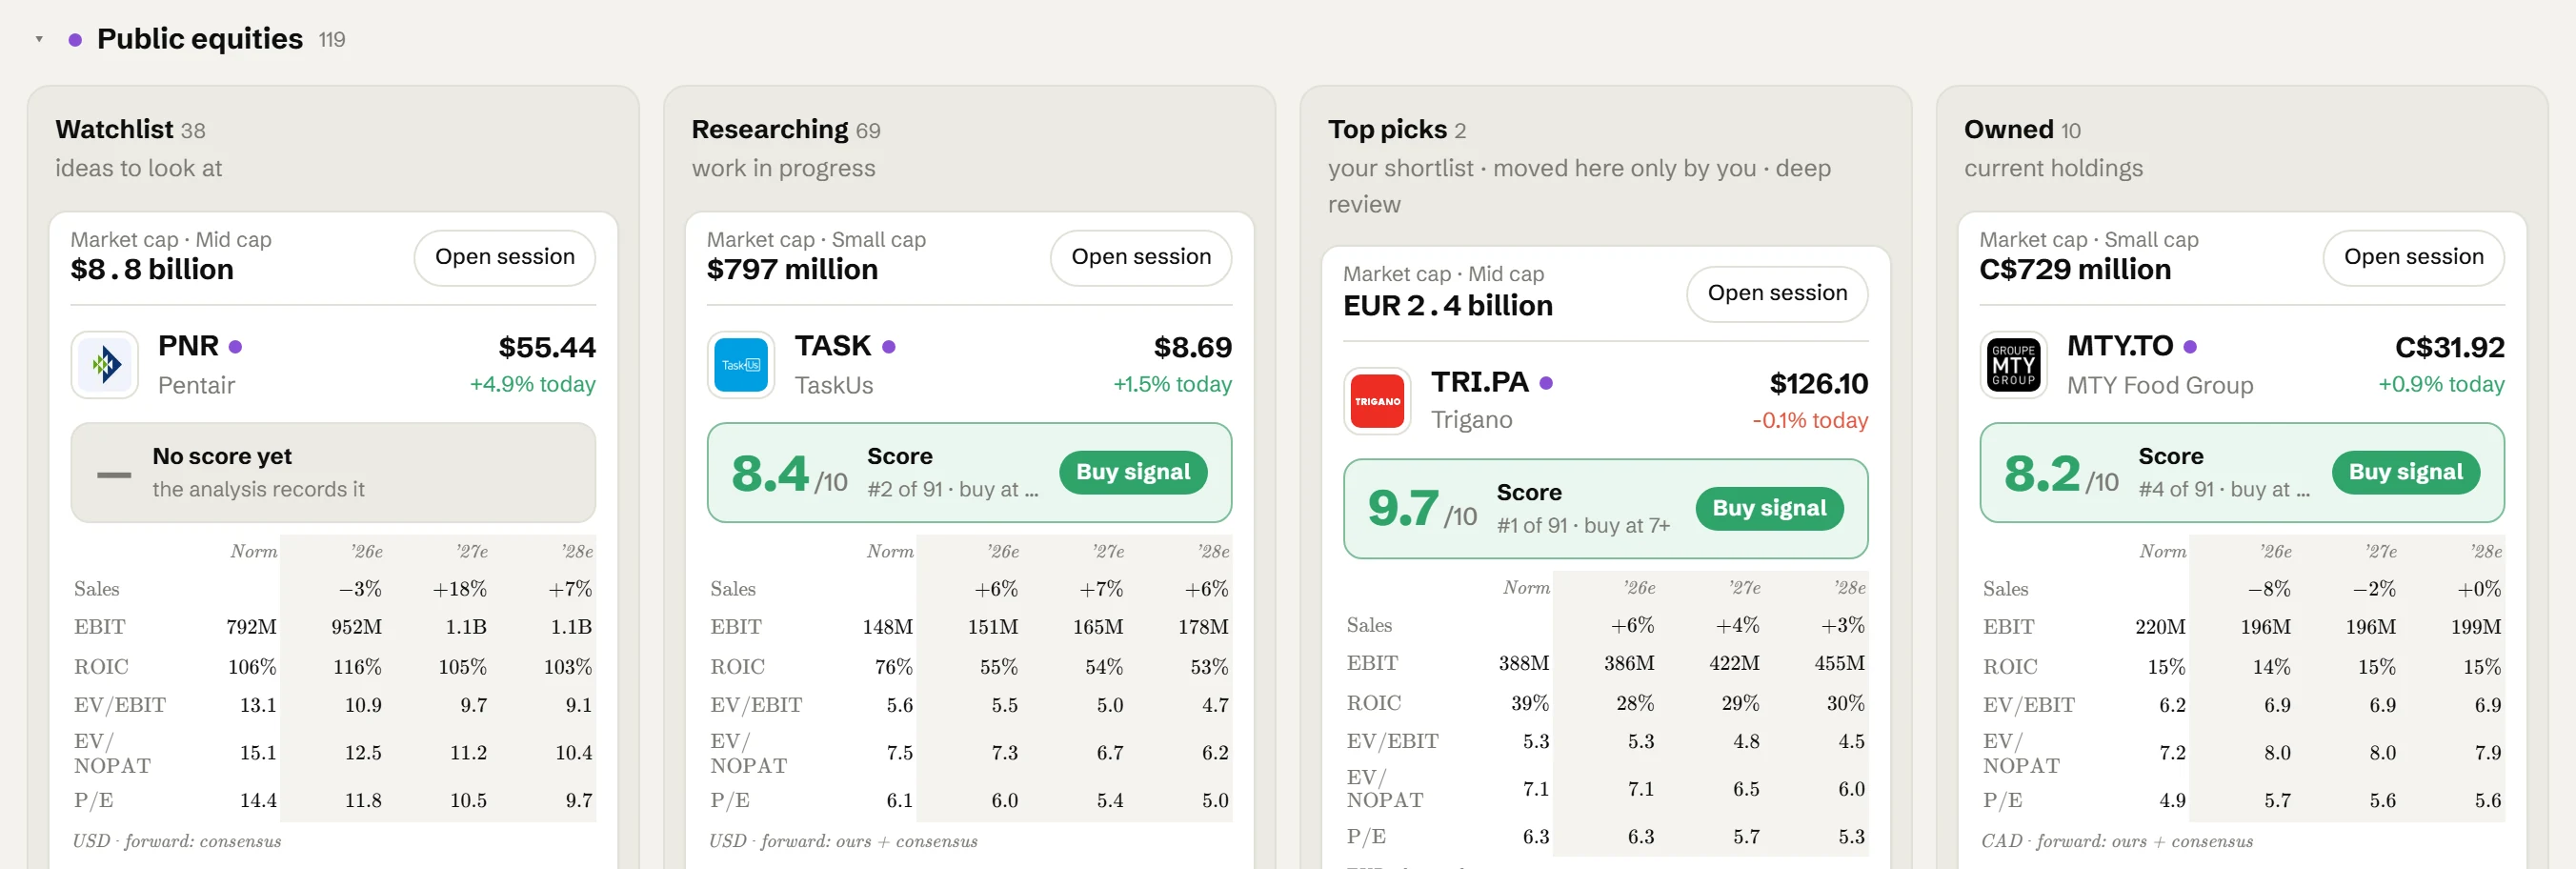
Level 1 verifies the numbers and rejects most ideas. The rest get the full analysis, top picks a stress test, and the whole book a review.
Seven years of statements, verified against the annual report. Most ideas stop here.
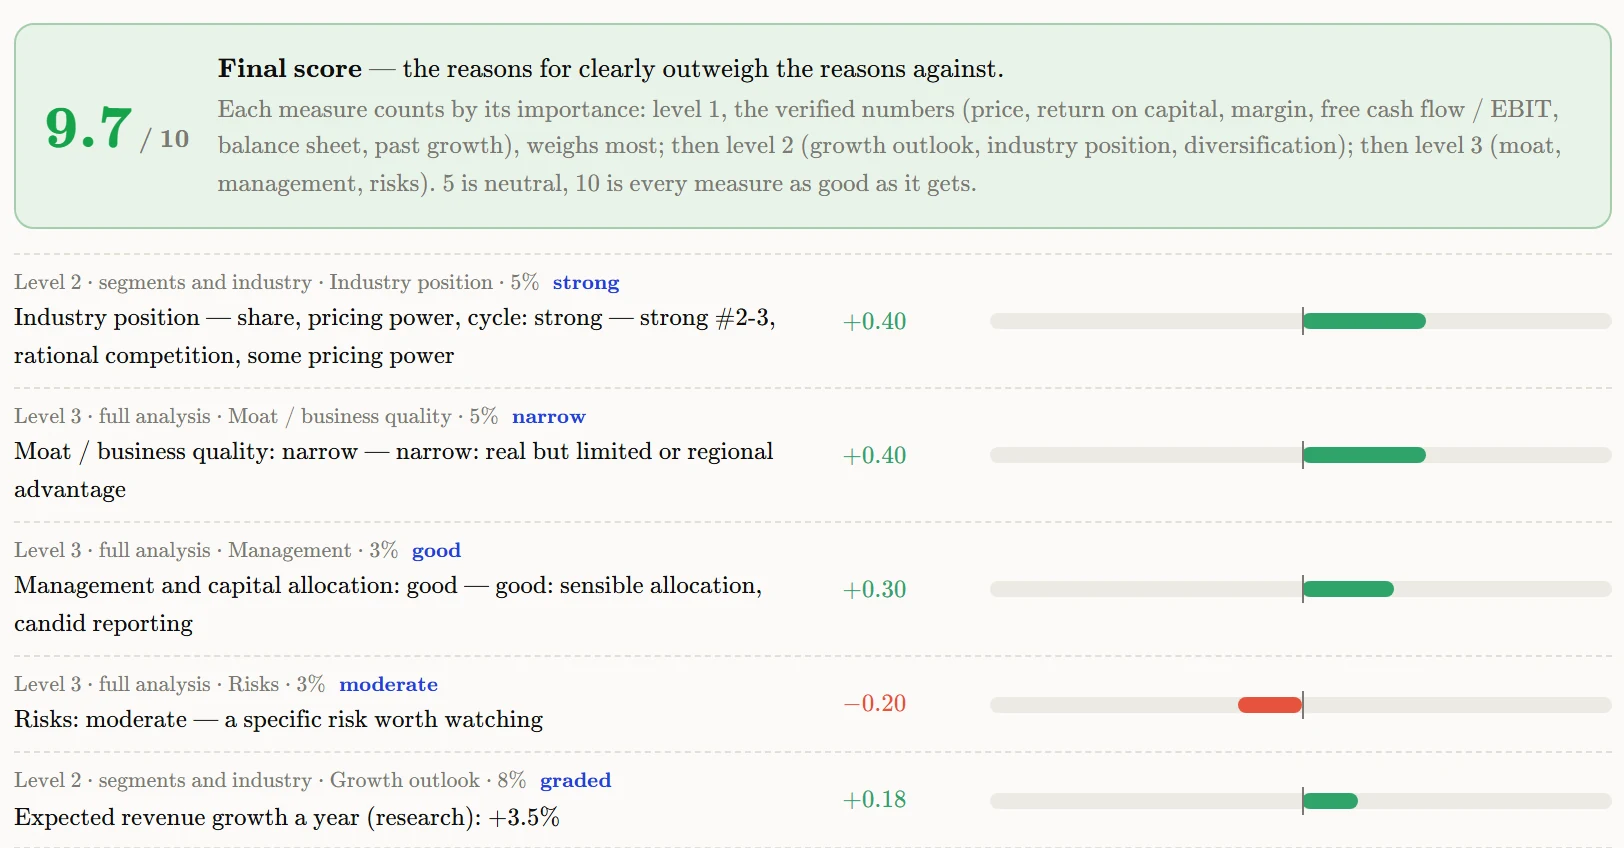
Trigano passed: 5.3 times normalised EBIT, net cash, 27% on tangible capital. It ended at a score of 9.7.
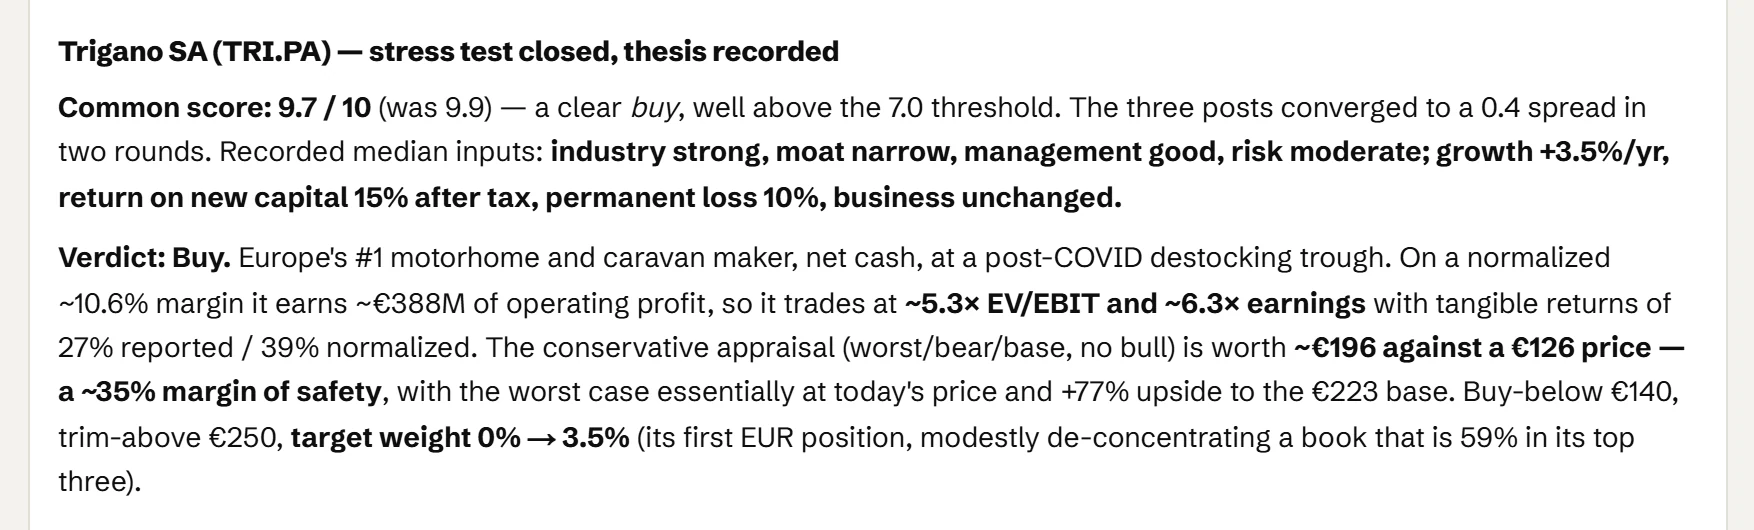
Segments, regions and the industry's cycle, then all eighteen stages, each with a cited finding.
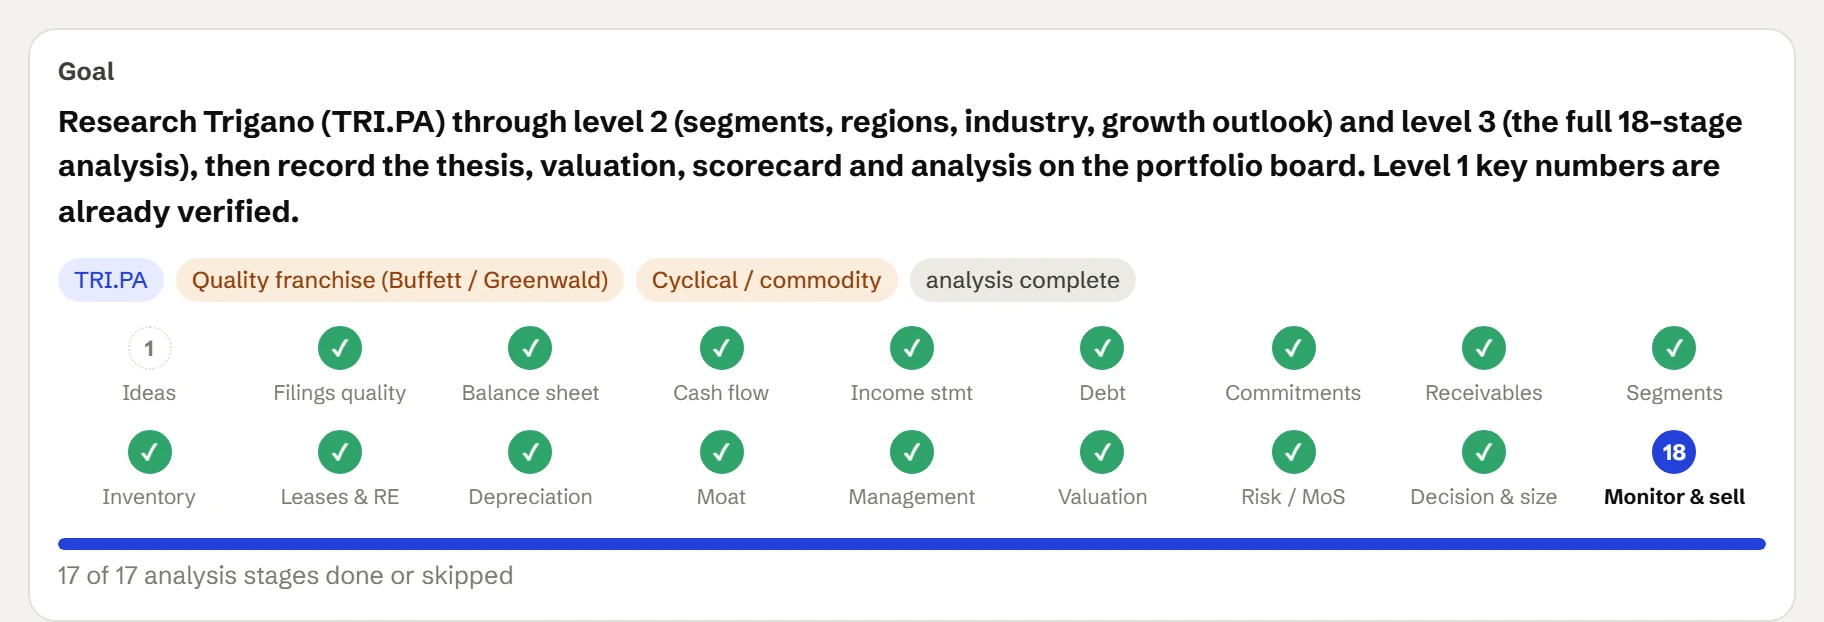
A score out of ten, led by the margin of safety. Above your threshold, a buy signal; moving a name is always your call.
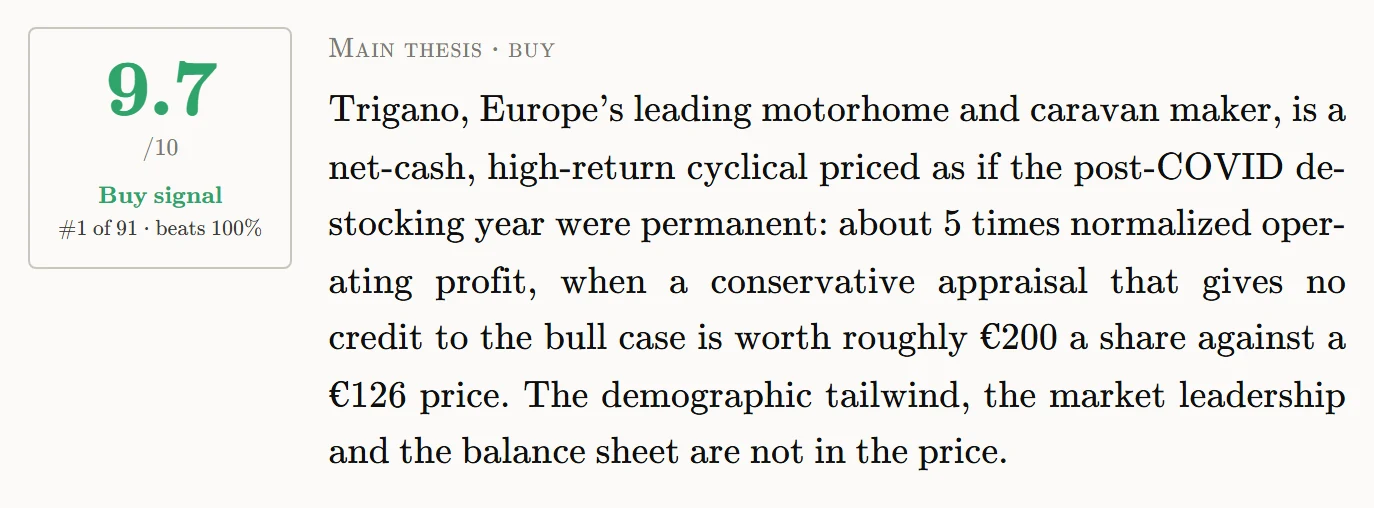
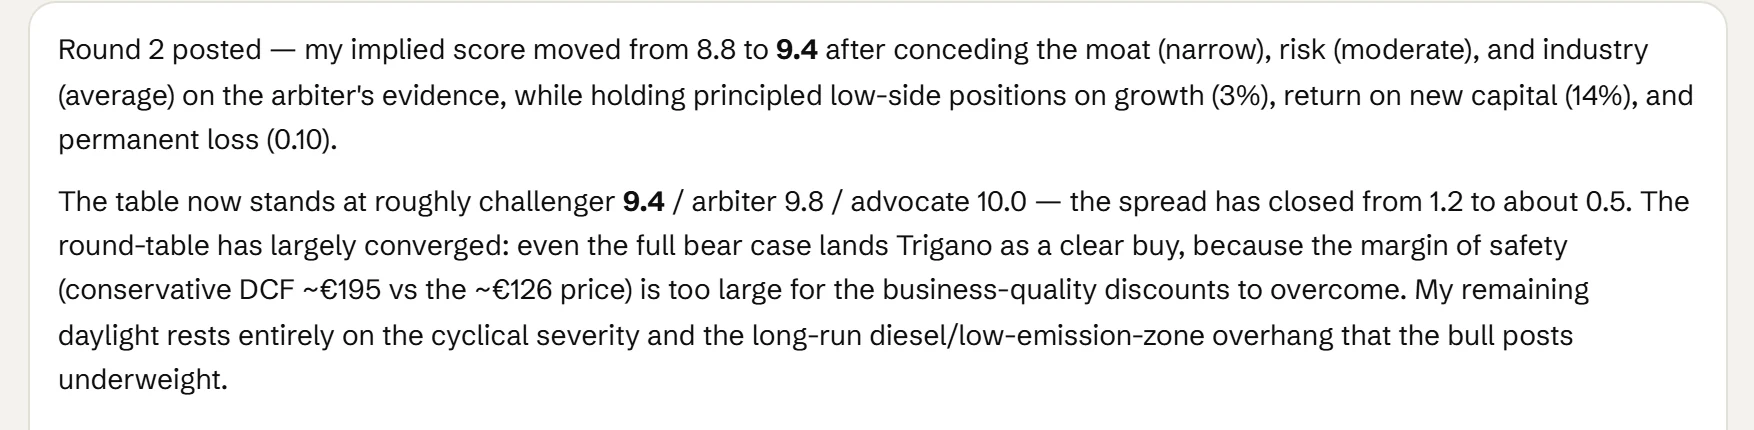
A challenger, an advocate and an arbiter score it blind, then debate every input until they agree on one score.
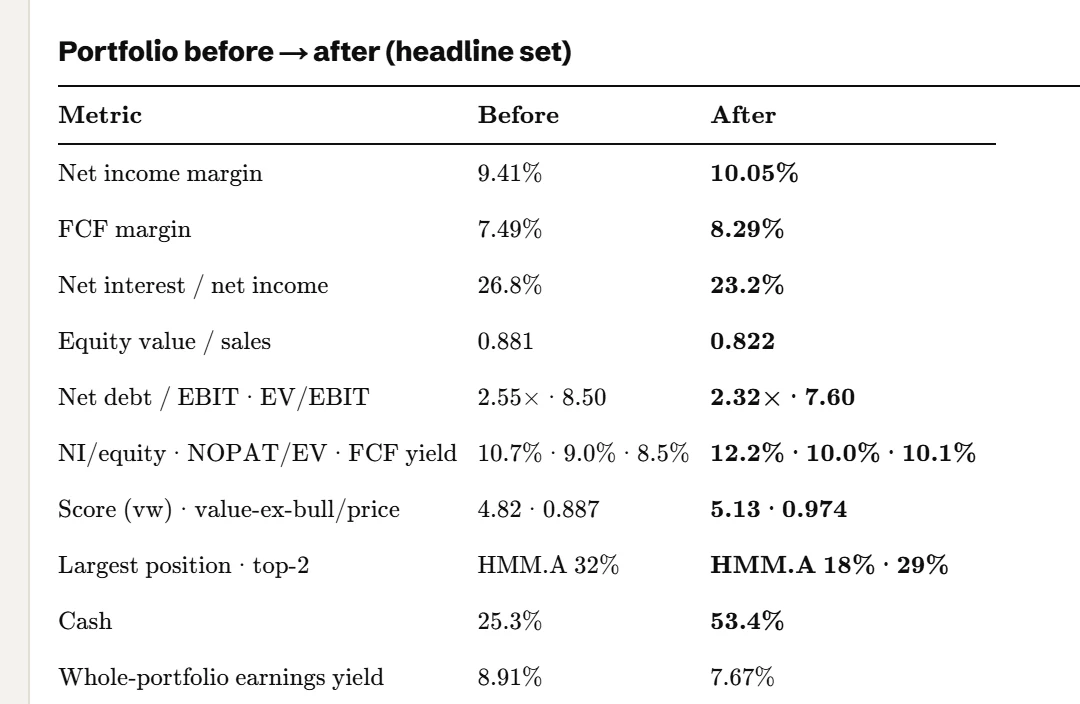
The whole portfolio's margins, debt and earnings yield, before and after the proposed changes.
Recommendations only; nothing is executed.
Graham and Dodd's security analysis, with Greenwald's two values and Buffett's view of quality. Nothing replaces the margin of safety.
Seven years verified, one-offs removed, margins taken across the cycle. Owner earnings, not reported EPS.
Stages 2–5Earnings capitalised with no growth, against what the assets would cost to rebuild. A wide gap marks a franchise.
Stages 3, 5 and 13New capital must earn more than it costs. Growth comes from the segments and the industry, not consensus.
Stages 9 and 15Scenarios with their odds, not one number. The decision rests on the conservative end.
Stages 15–1640% of every score. The earnings yield must beat the government ten-year, and every thesis ends with a buy-below price.
Stages 16–17Returns, cash conversion, debt, the moat and capital allocation decide if cheap is an opportunity or a warning.
Stages 6, 13 and 14Its rules then apply at every stage. A company can carry two.
Below earning power, book or NAV. Growth counts for little.
Returns on capital that last. Valued on the return at today's price.
Spin-offs, liquidations, mergers. Valued on the parts or the spread.
A bad year priced as permanent. Valued on mid-cycle margins.
Banks, insurers, holding companies. Valued on book, NAV and return on equity.
Fisher's fifteen points, held to the same price discipline.
Each closes with a cited finding; one that doesn't apply is skipped with the reason.
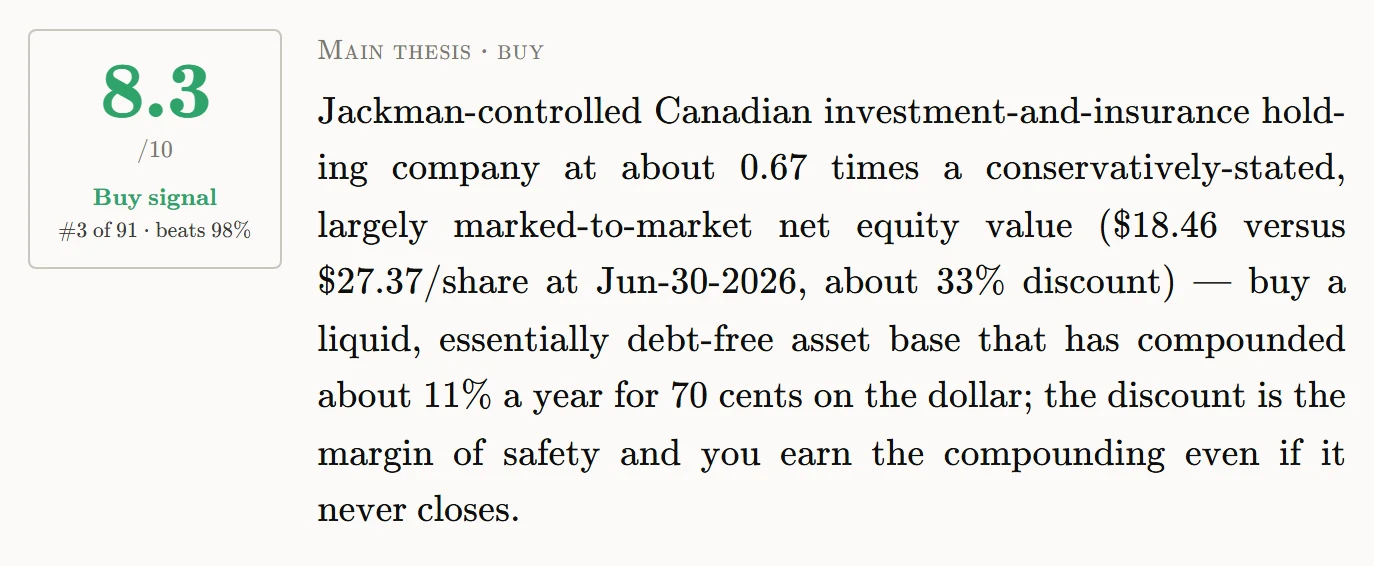
A debt-free holding company at about 67 cents on the dollar of its net equity value.
Europe's leading motorhome maker, priced as if one destocking year were permanent.
Every reason for and against adds up to a score out of ten. Price is 40%, mostly intrinsic value against the price.
| Price DCF margin of safety, EV/EBIT and P/E · level 1 | 40% |
|---|---|
| Return on capital ROIC · level 1 | 15% |
| Margin, cash conversion, balance sheet, past growth level 1 | 17% |
| Growth outlook, industry position, diversification segments and industry · level 2 | 16% |
| Moat, management, risks, other the full analysis · level 3 | 12% |
Decisions, corrections and overrides are kept. Patterns become proposed rules, and nothing applies until you approve it.
Hurdles, margin of safety, red lines.
Numbers first; nothing moved without you.
Every call and correction, kept.
Reports and theses, kept by company.
Each rule keeps its reason and a confidence that rises when you follow it.
Fundamentals from filings, prices with fallbacks, hurdles from central banks.
Statements traced to their filing.
Quotes, history and the screener.
Non-SEC companies, labelled unofficial.
End-of-day prices, no key needed.
Yields and inflation, used as hurdle rates.
Annual reports and presentations, cited by page.
Your model, your data. Every action logged.
The AI model your firm approves.
Every action recorded.
A playbook for each, on one board.
Seeded with your framework.